VascularCell is an official publication of the Australasian Immunohistochemistry Society
The Australasian Immunohistochemistry Society (AIS) (https://aaihc.org.au/) fully endorses Vascular Cell. The Australasian Immunohistochemistry Society (AIS) represents a hub of knowledge aiming to advance knowledge by the collaborative effort of experts from all areas of biomedical sciences and histopathology with interest in diagnostic and research immunohistochemistry. Read more ...

The Best Microscopic Photography
The winner of the first edition of the VascularCell Image Contest is Mr. Raul Peña from Fundación IMIM. He will receive a voucher for free article publication in VascularCell journal.
Let's put some Art into Science!
Aims and scope
Vascular Cell represents an open access medical journal which concentrates on publication of a wide range of topics related to the vascular system including neo-vascularization and angiogenesis. Since vascular endothelial cells represent a crucial factor in numerous pathological conditions such as: cancer, stroke, myocardial infarction or atherosclerosis their behavior is of paramount importance for the clinical outcomes of a wide range of patients.
VascularCell indexing
We are in the process of reindexing VascularCell with PubMed. Currently PubMed holds the archive of Vascular Cell articles published between 2009-2017
Latest Articles
VascularCell articles from Volume 15 (issue 1), published in 2025.
A 3-Dimensional Hypothesis of Oxidative Phosphorylation
Published in Vascular Cell 14(1):1 on 2023-03-27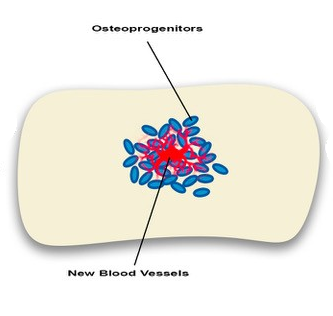
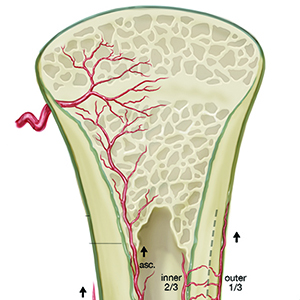
Angiogenesis-osteogenesis coupling: a key element in bone physiology and regeneration
Published in Vascular Cell 13(1):2 on 2021-12-20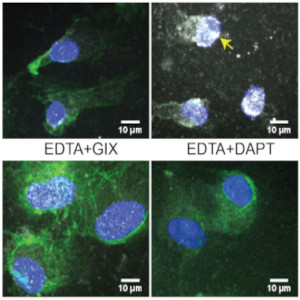
The long and winding road: detecting and quantifying Notch activation in endothelial cells
Published in Vascular Cell 13(1):1 on 2021-12-20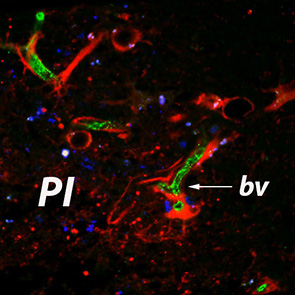
A clinically relevant model of stroke using aged rats
Published in Vascular Cell 12(1):6 on 2020-11-16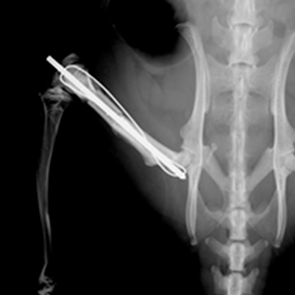
Vascular Tumors Result from Adeno-Associated Virus-9 Angiogenic Gene Therapy of Bone Allografts
Published in Vascular Cell 12(1):3 on 2020-11-16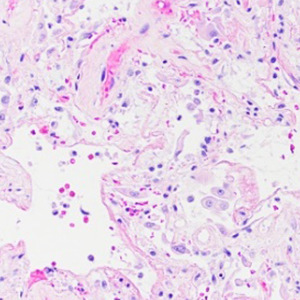
The SARS-CoV2 - ACE2 link: a physiopathological analysis
Published in Vascular Cell 12(1):5 on 2020-08-03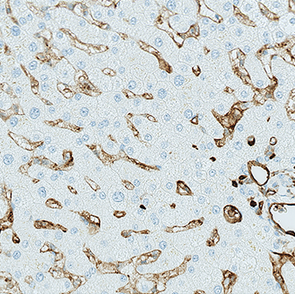
External Quality Assessments of CD31 Immunoassays – the NordiQC experience
Published in Vascular Cell 12(1):4 on 2020-07-30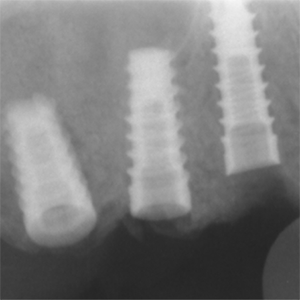
Multidisciplinary approach to maximize angiogenesis and wound healing using piezoelectric surgery, concentrated growth factors and photobiomodulation for dental implant placement surgery involving lateral wall sinus lift: two case reports.
Published in Vascular Cell 12(1):2 on 2020-06-11